Bars Like Gantt chart bars - but more
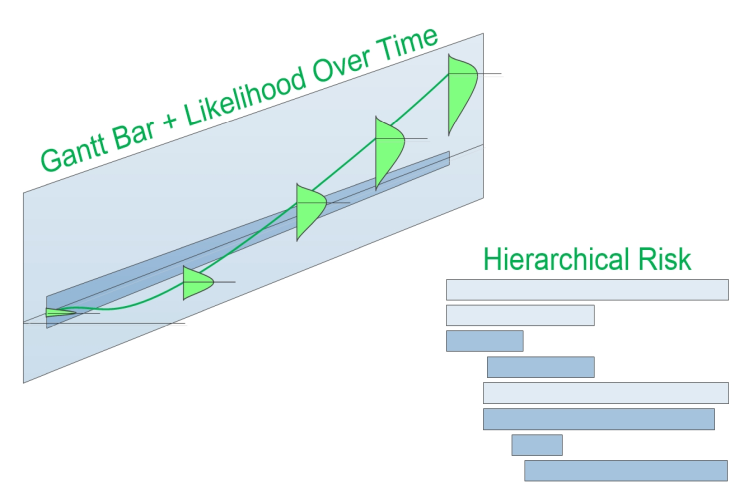
Bars hold Probability Fans
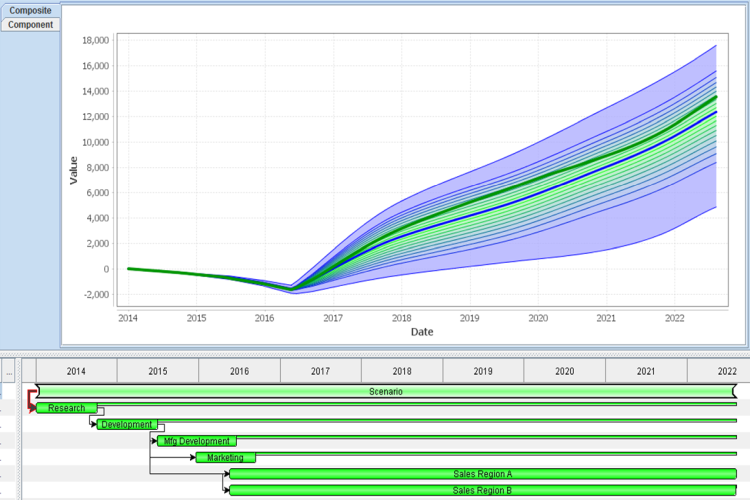
The base concept is simple: A Gantt-like model of heirarchical bars varying in time. Where each bar also contains:
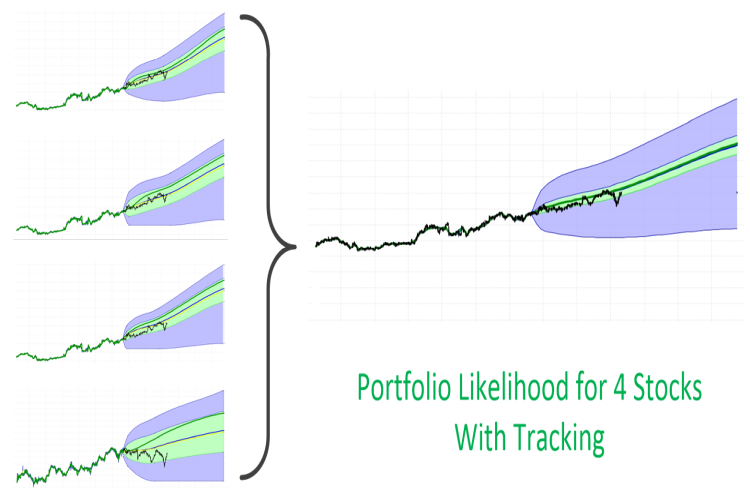
- Probability distributions at points in time along each bar - showing expected likelihood of achieving value at that time, and forming Probability Fans.
- Tracking data (after project start, and when available) showing actual achieved value at points in time along each bar
- Annotation data collecting who, when, and why information about entered likelihood probability distributions input on each ACTIVITY bar.
4 types of Bars
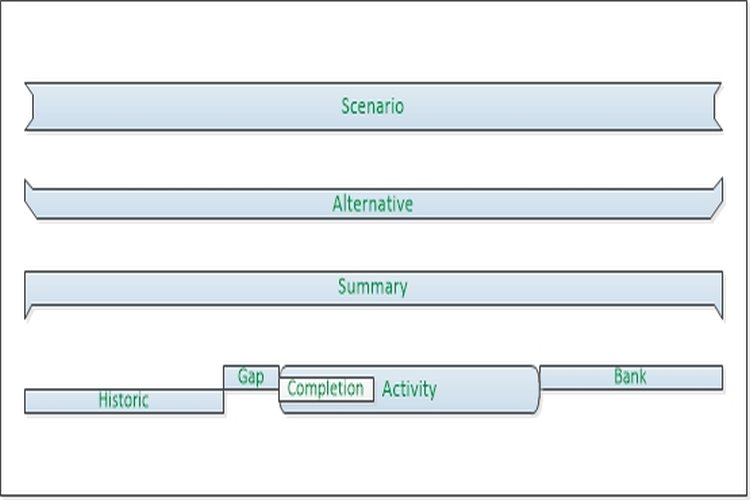
Each bar represents either:- SCENARIO bar - a special type of SUMMARY bar that may have two or more ALTERNATIVE bars as children.
- ALTERNATIVE bar - a special type of SUMMARY bar that has a SCENARIO bar as it's parent.
- SUMMARY bar - similar to a Gantt summary bar.
- ACTIVITY - any individual factor that affects risk and reward over time for that aggregate plan.
- HISTORIC bar - Holds historic data ( e.g. past Stock or task performance )
- GAP bar - Holds modeling data between HISTORIC and ACTIVITY bars ( e.g. Current budget data goes through April. New project starts in June ).
- ACTIVITY bar - Holds Probability distributions at points in time along each ACTIVITY bar - showing expected likelihood of achieving value at that time, and forming ACTIVITY bar Probability Fans.
- BANK bar - Since we're calculating likelihood of achieving value over time, when the ACTIVITY bar stops, the value doesn't go away. It's stored in the BANK bar.
- Contains:
ALTERNATIVE and SCENARIO bars are added to support Scenario Planning , Analysis of Alternatives (AoA) , and weighted views of Alternative Futures , by allowing the calculation of aggregate SCENARIO Probability Fans from weighted ALTERNATIVES ( e.g. SCENARIO X shows: 40% of ALTERNATIVE A plus 60 % of ALTERNATIVE B ).