Probability Fan Shows potential value over time
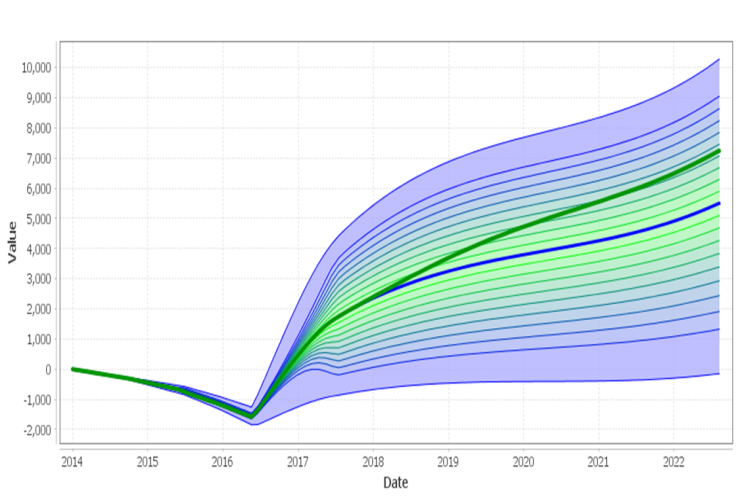
Probability Fan
Shows likelihood of achieving value over time.
Shape
Think of the new business takeoff runway analogy. The Probability Fan shows all the probable flight paths, and Likelihood of profit or loss at all times along the plan.
Gradient Lines and Colors
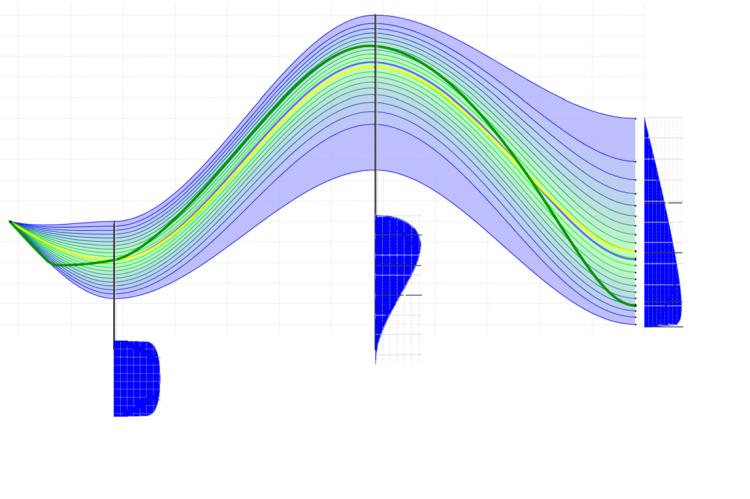
A 2D represenation of 3D data:
- X axis = Time
- Y axis = Value
- Z axis = Likelihood
Gradient Lines within the Probability Fan are analogous to contour lines on a Topographic Map. Working from outside to inside, each pair of Gradient Lines represents the same likelihood (elevation) on the underlying probability distribution (hill).
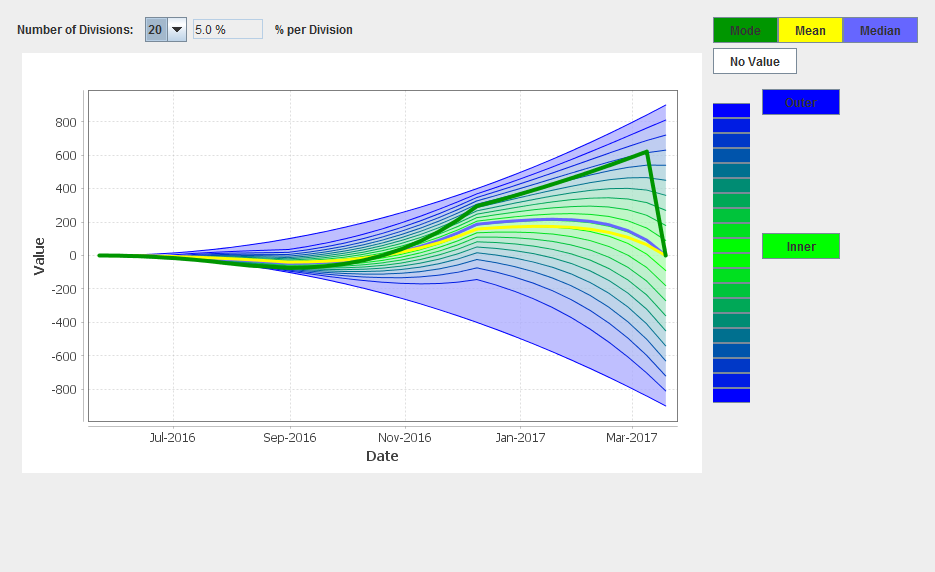
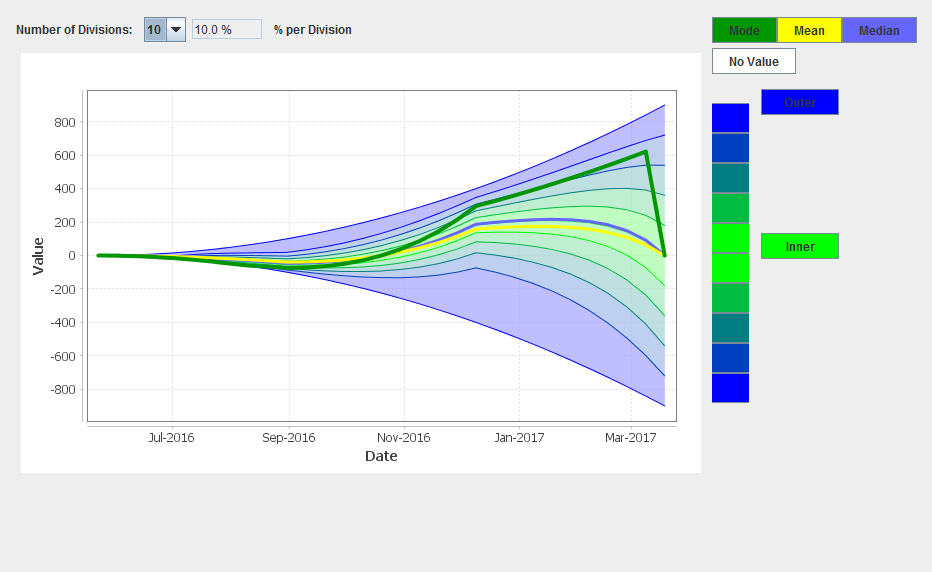
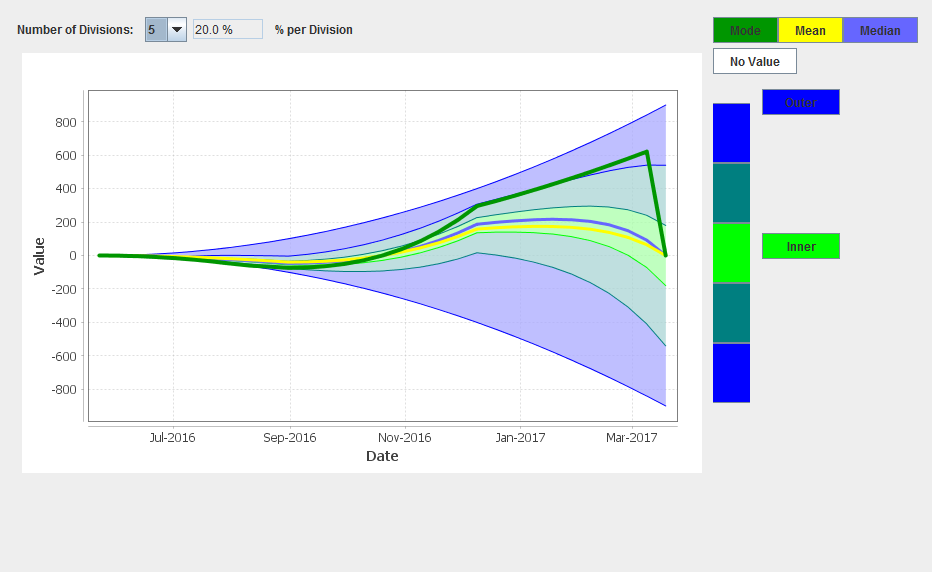
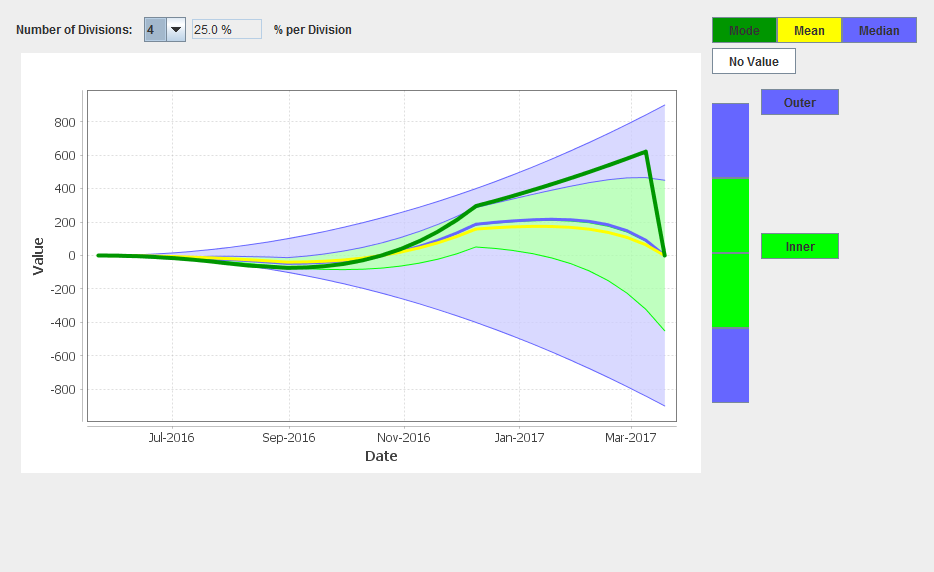
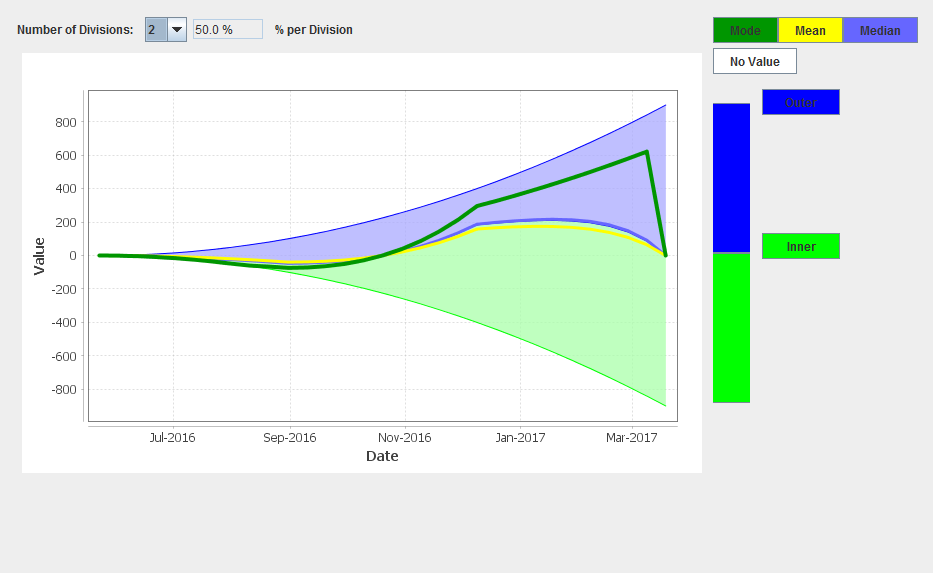
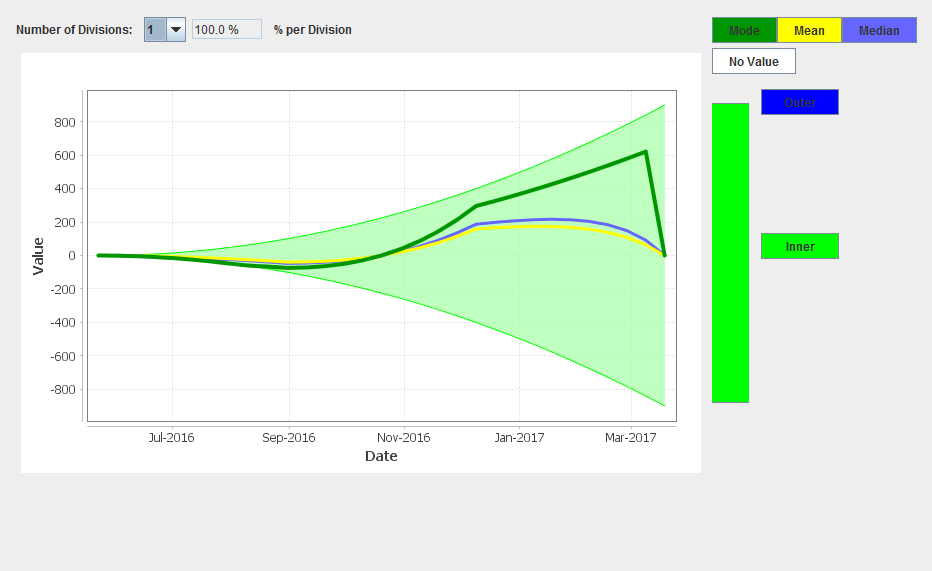
Mode , Mean , and Median - lines are displayed showing how these statistical measures change over time.
Number of Divisions in the Probability Fan can be changed to highlight Likelihood.
This powerful new way of looking at likelihood over time or other X axis value is both Copyrighted, and covered by Patent.