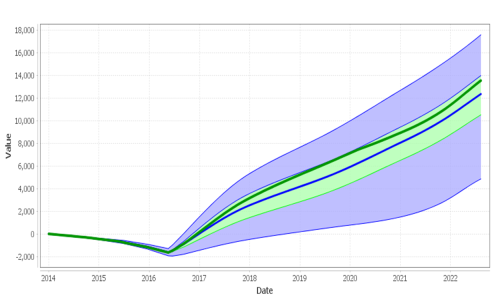
Visualize risk over time - Probability Fan
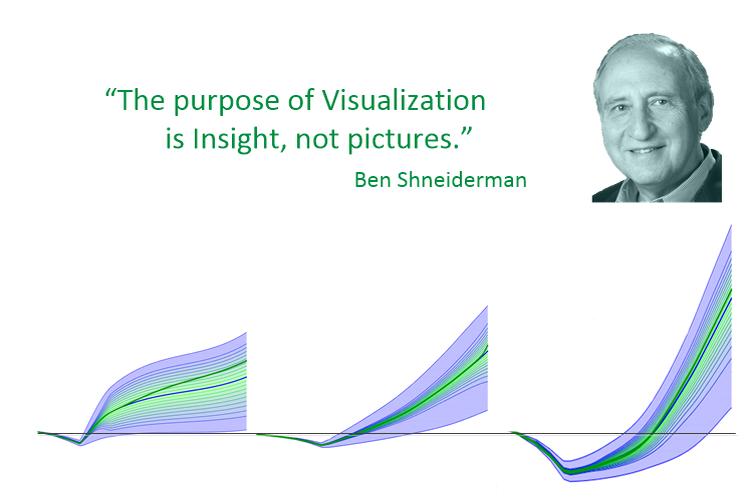

Visualize & Communicate
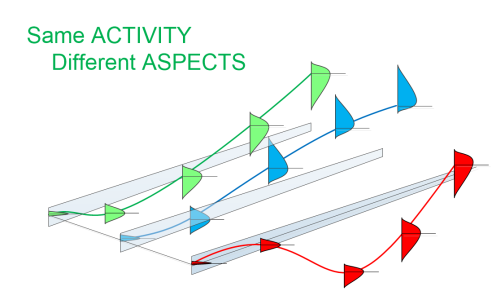
- Potential value over time
- Likelihood of achieving desired results
Using what we call a Probability Fan.
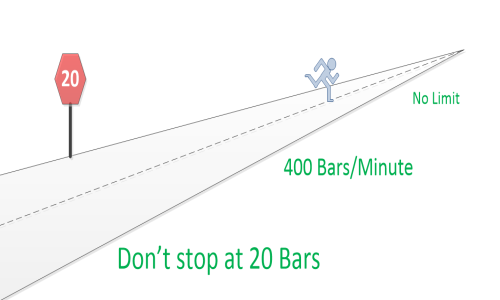
Think of the new business takeoff runway analogy. The Probability Fan shows all the probable flight paths, and Likelihood of profit or loss at all times along the plan.
Mode, Mean, and Median - lines are displayed showing how these statistical measures change over time.
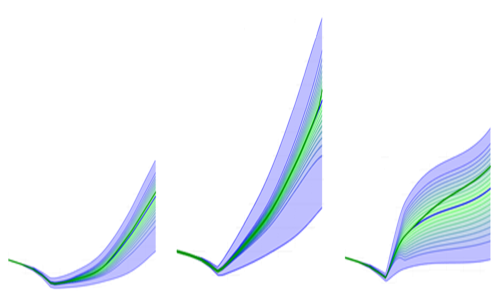
Number of Divisions in the Probability Fan can be changed to highlight Likelihood.
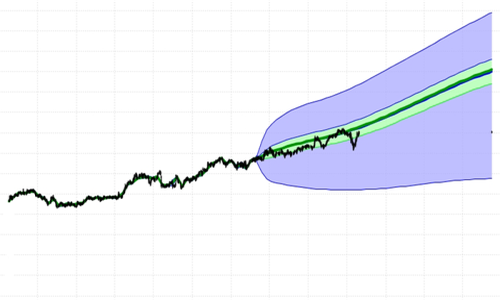
In FutureValue 4 you can "zoom in" anywhere on the chart to read exact measures of Likelihood.
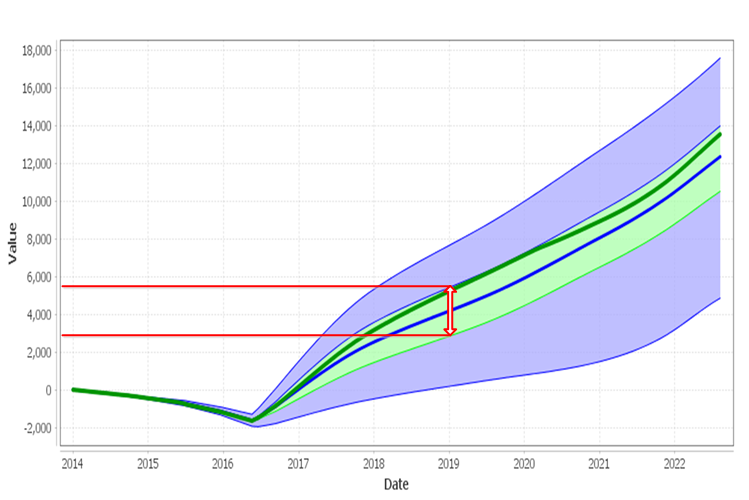
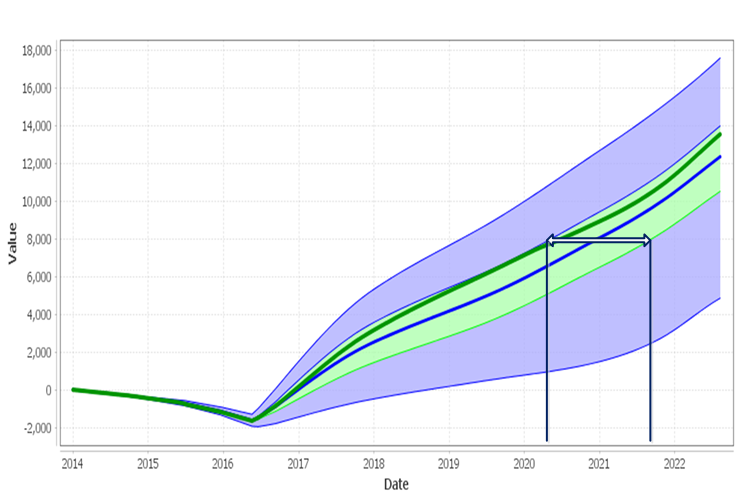
Slice the Probability Fan:
- Vertical = Likelihood of Value at a point in Time
- Horizontal = Likelihood in Time of achieving Value
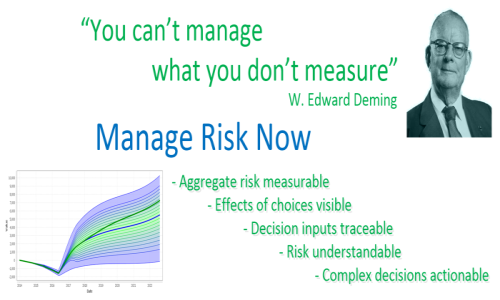
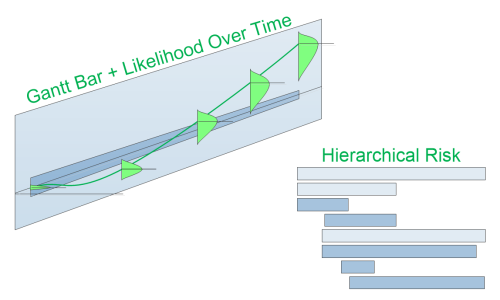
Coupled with a
Gantt-like view of interconnectivity,
Tracking ,
Drill-Down , and
Annotations this gives you new and fairly complete set of tools to Visualize,
Communicate, and
Manage risk and reward over time.
New tools to understand risk in complex decisions, and Gain
Insight