More Accurate A lot more accurate
More Accurate
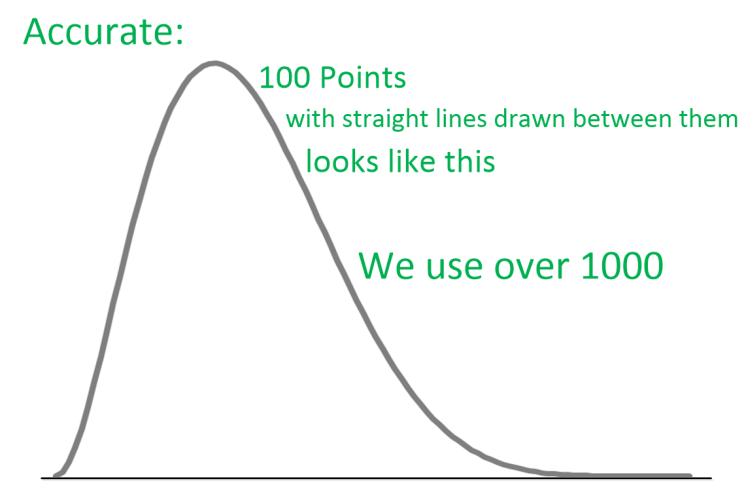
We use over 1000 points to model each probability distribution - so we're more accurate.
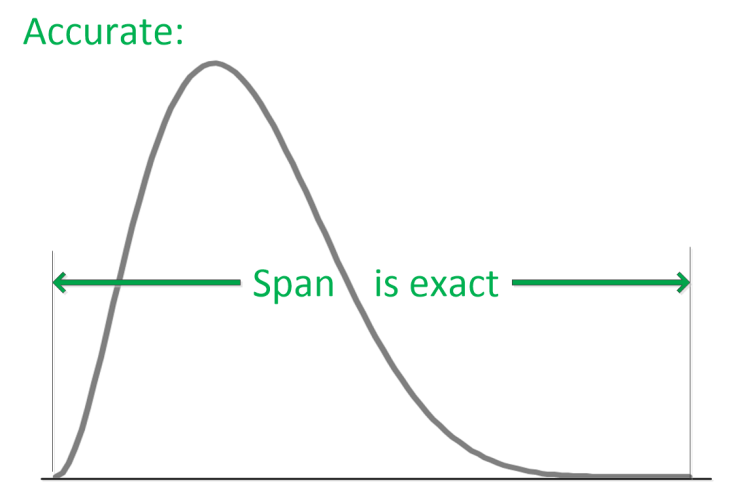
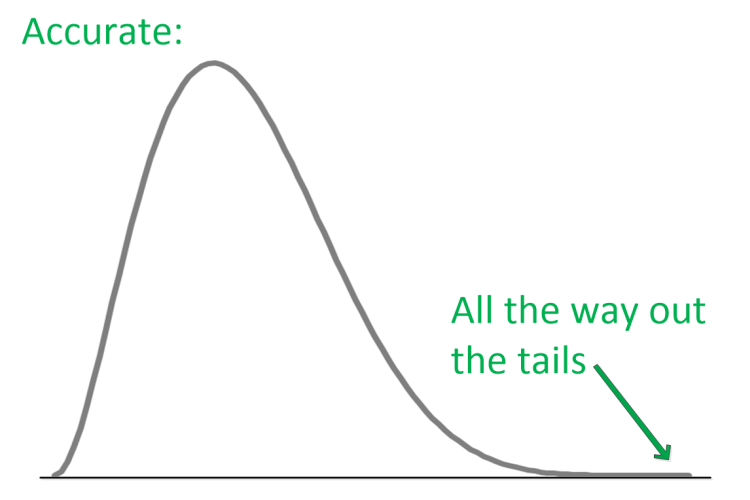
And, we have full accuracy all along the span of every distribution modeled - all the way out to the distribution tails - so we're more accurate.
But, it goes beyond that.
We do this for every probability density distribution calculated... no
matter how many hundreds of
Bars went into the aggregate calculation.
Do you care about the mean, the mode, or the shape of the distribution and the tails?
Which characteristics make you money? Cost you money?
Details
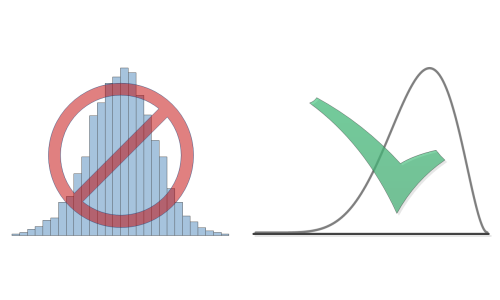
Typical risk modeling uses one form or another of Monte-Carlo modeling. To generate aggregate likelihood distributions, they run many single value models, aggregate the results into bins, and produce histograms:
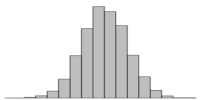
Typical (Monte-Carlo ) methods will get the center of the distribution mostly right, but fail to correctly model outlying shoulders and the tails.
Bell curves - Normal distributions - are bad.
Or, to be more correct.. Are sometimes correct.
If, as some software does, the resultant histogram is converted to a mean
and standard deviation, then, you are guaranteed the distribution shape
is to some degree wrong.
e.g. The histogram above has some skew. A Normal distribution fit says
it does not.
The Normal distribution is defined by mean and standard deviation. By
definition, the distribution always goes from minus infinity to plus infinity.
So, by definition, nothing in this world fits a Normal distribution.
Grades don't go from -∞ to +∞.
Stock value of a company does not go from -∞ to +∞.
Nothing on this world does. It's an approximate. You're betting money
on it. Is it good enough? There's a statistical test for that - typically
some form of sum of distances fit.
The tails are wrong. So, how about the shape?
In probability theory, the Central Limit Theorem states that, given certain
conditions, the arithmetic mean of a sufficiently large number of iterates
of independent random variables, each with a well-defined expected value
and well-defined variance, will be approximately normally distributed,
regardless of the underlying distribution.
Approximately normal - after combining how many quant models?
Don't know? With our methods, it's easy to see: The answer depends on
how many models are combined, and how skewed the distributions are.
Your incomming model distributions are likely skewed - not normal distributions.
How many investment opportunities have you seen where the upside likelihood
had the same span and shape as the downside?
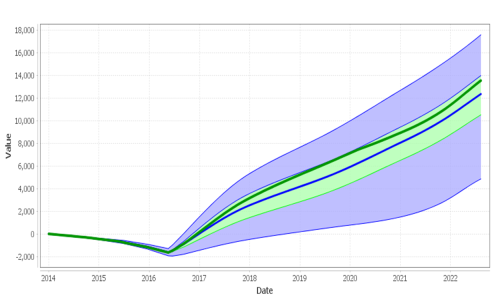
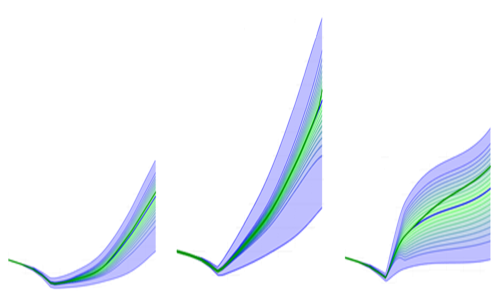
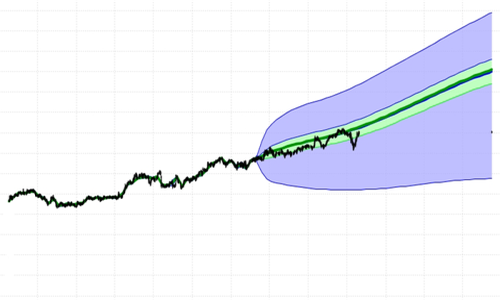
The 4 Probability Fans to the left in the plot above represent future value likelihood models for 4 different stocks. All 4 models have different degrees of asymmetry (blue topside not the same as blue bottom side, mode lines high, etc). Note: The aggregate Probability Fan for the 4 stocks (right side in the plot above) also shows asymmetry. But note: the green (+-25%) area looks to be more symmetric - the Central Limit Theorem beginning to work.
Aside from using more points to approximate every continuous probability
density distribution modeled, and having methods that yield full accuracy
along the entire span of every distribution.
We're more accrate because we don't use Normal distributions.
We don't use any distributions that go from minus infinity to plus infinity.
All the probability distributions used in FutureValue 4.0 are bounded.
Any of the input distributions can take any shape or form of skew you
would like.
Aggregate outputs are accurate.