Easy to use Complex modeling with no math needed
A simple paradigm - something you know
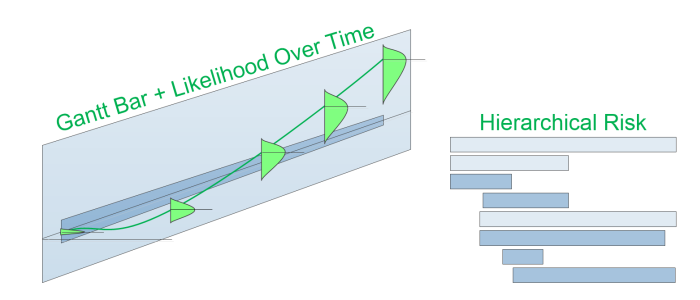
A Gantt chart
So, you've done project planning before. You've used Gantt charts. Tasks in time with beginning dates and end dates. With Parent-Child associations between tasks- aggregating to SUMMARY tasks.
Our modeling is like that, but with each ACTIVITY bar on the Gantt chart not only showing start and stop dates, but also showing that task's liklihood of achieving values over time.
Our solver then takes the information on liklihood over time entered for all Child ACTIVITY bars, and calculates liklihood values over time for all Parent SUMMARY bars in the entire heirarchy.
You now have the ability to assemble complex Heirarchical Risk models with the same ease you would assemble a Gantt chart for a project.
No Math Needed
1 ACTIVITY Bar = 1 quant model
So... a complex Heirarchy of models is easy... like a Gantt Chart.
Let's make the modeling easy too:
How about if your domain experts built the liklihood over time models themselves. Annotate the models to capture why they made assumptions in the first place, and had the ability to quickly change models or adjust plans - if tracking shows it's needed.
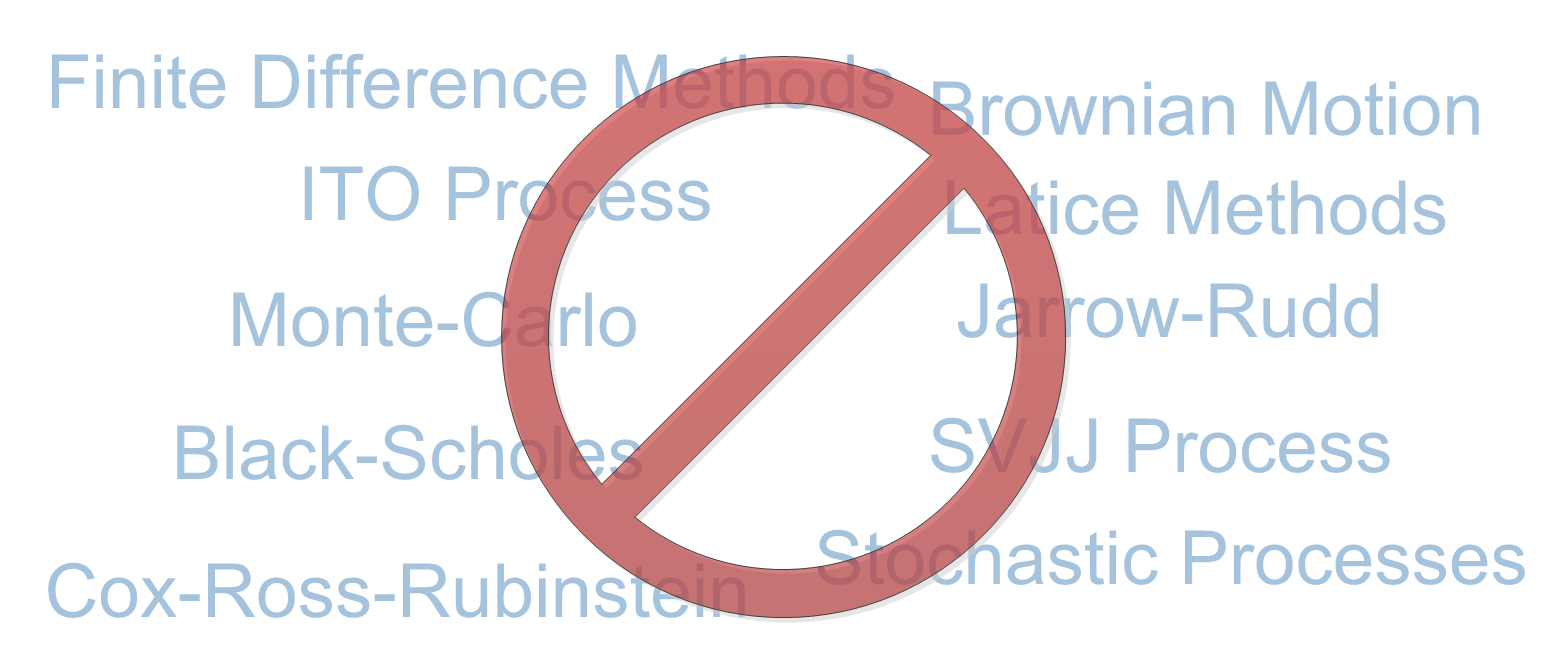
No Complex Financial Modeling
Rather use your Quant models - we can use them too.
Financial modelling is about translating a set of hypotheses about the
behavior of markets or agents into numerical predictions.
See:
Building typical financial models entails genrating complicated numerical models - usualy by having programers (who know little about the problem) work with domain experts (who know little about programming) - working back and forth - validating - till they get a model for that aspect of the problem right. Then, they use a different numerical method to aggregate different models.
Although almost everybody does it this way, no one ever said you had to do it one point at a time ( Patents issued and pending).


