Your experts - Your risk models - No Math Needed
Business use case
You're going to release a new product line.
You use FutureValue 4 Gantt-like modeling to plan risk.
No outside expert knows how well your people execute.
You have internal manufacturing experts that can tell you - with some
confidence - how long and how much for that new manufacturing line - with
cost and time hedging based on past experience.
By having your experts enter likelihood distributions at points in time
in our software, for the Gantt bar tasks they have responsibility for,
it's easy for them to hedge their guesses as to likely costs - and have
that show up on the risk/reward plan.
You have marketing experts that can ballpark the likely campaign costs.
You have experts in sales for regional markets A,B, and C.
Let each internal expert build his or her part of the risk plan.
Go right from their minds - to our software.
No programmers needed.
Pull all your expert's contributions together, and you have the start
of a
comprehensive risk/reward plan
- that now shows risk, reward, and likelihood of success.
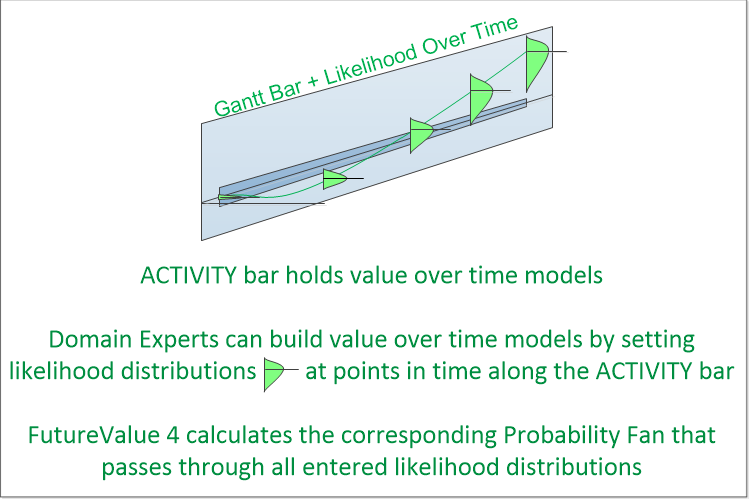
Risk models - Built directly by your Domain Experts - No Math needed
Domain Experts can build their own Value over time Risk/Reward models
by
Building a Gantt-like chart in FutureValue 4 where:
- Each ACTIVITY Bar on the chart represents some Activity that will affect likelihood of success or likely Value
- Internal - expected tasks and actions
- External - e.g. expected regulatory tailwinds or various competitive headwinds
- Each Summary type Bar on the chart represents a place in the model heirarchy where the Domain Experts would like to see aggregate Risk/Reward Probability Fans.
Each source of Risk or Reward is a seperate model - a seperate ACTIVITY Bar on the Gantt-like chart.
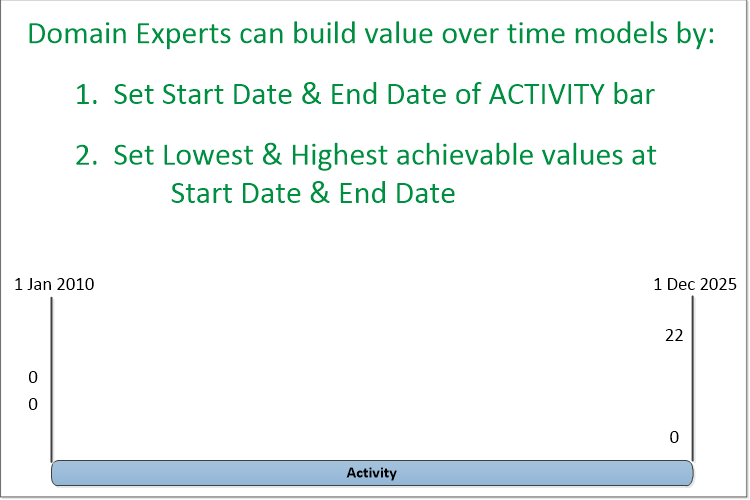
For each Activity Bar in the model heirarchy (Gantt-like chart), Experts then:
- Set Start & End Date
- Set Lowest & Highest achievable values at Start Date & End Date
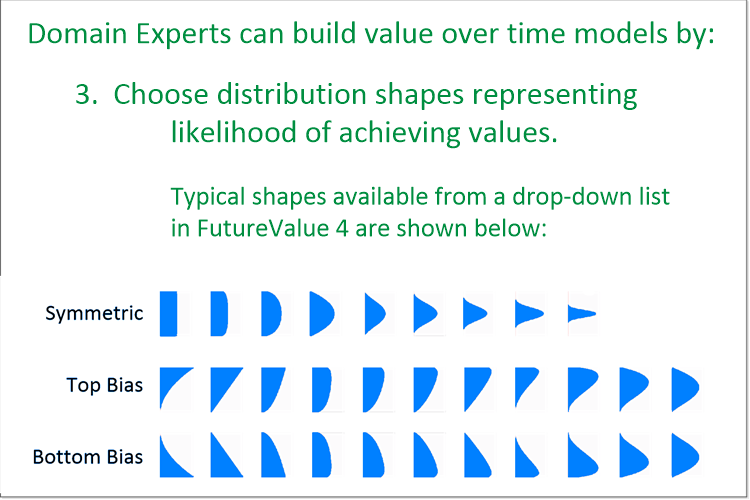
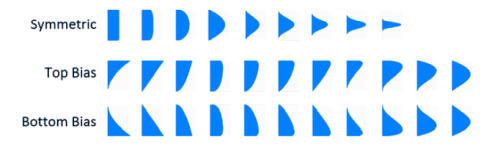
- Choose likelihood distribution shapes - from a Drop-Down list of shapes
- representing likelihood of achieving values.
By setting - Lowest & Highest achievable values, and likelihood shape - your Expert has just set - likelihood of achieving Value - over a range of Values - at a Date. - IF you want a linear variation of Risk and Reward between Start Date and
End Date... you're done.
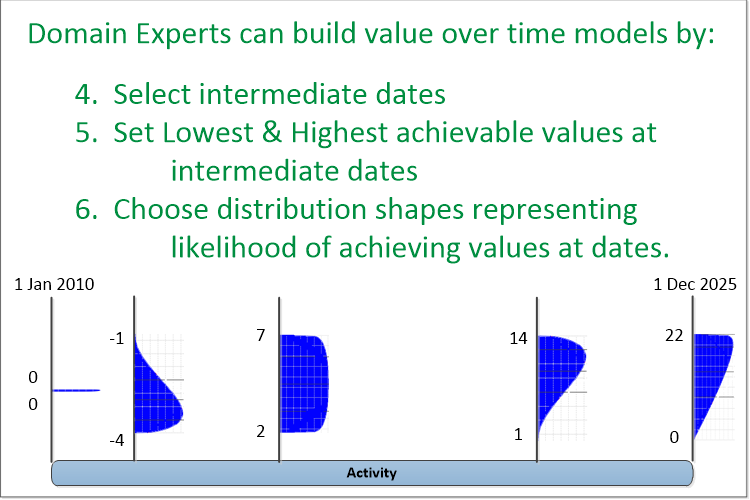
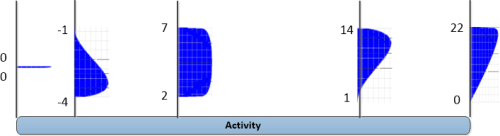
For non-Linear variations between Start & End Dates: - Select some intermediate dates
- Set Lowest & Highest achievable values at each intermediate date selected
- Choose distribution shapes representing likelihood of achieving values at each intermediate date.
- Use FutureValue 4 software graphically inspect the variations in likelihood of achieving Value over time entered.
- In the software, adjust intermediate dates, high & low values, and shapes... until the resultant graphic display of expected likelihood and values meets Domain Expert's expectations.
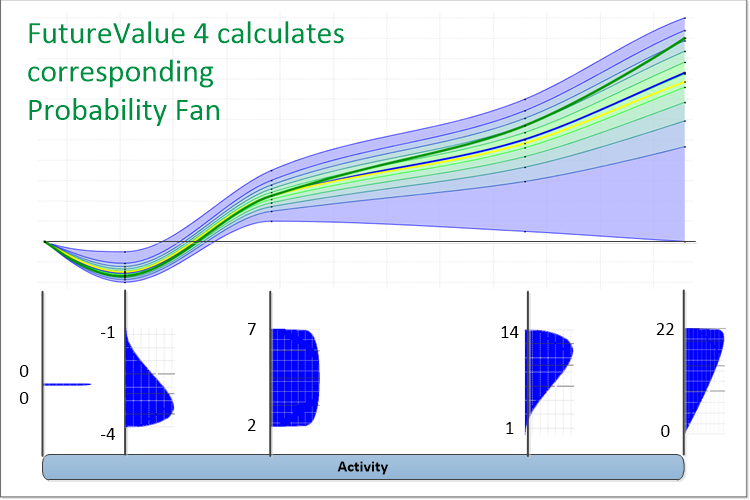
Your Domain Experts selected Dates, and entered expected high & low
values, and shapes...
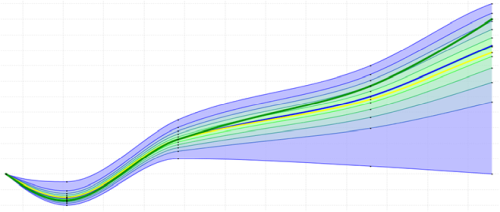
Your Domain Experts inspected the FutureValue 4 generated Probability Fan, and the graphically displayed likelihood over time model matches their expectations - for that ACTIVITY:
Now.. build Risk/Reward models for all the other Activities on the plan.
With all the ACTIVITY Risk/Reward models set, and all the Summary Bars
and heirarchy defined - you've built your risk plan.
Now, run FutureValue 4. Generate all the aggregate
Probability Fans. You can now see aggregate risk and reward over your entire plan.
It's too simple
Yes, the data entry to build a single factor risk model can be that simple.
But, if you would rather define the distribution shapes representing likelihood of achieving value at Dates numerically - FutureValue 4 accepts some of those types of inputs too.
We work with likelihood disteributions varying over time - part of our Patentsissued and pending methods.
Your plan - built by your Experts
If you were running our software, you could build the plan with your assumptions, meeting the Complexity of your product launch.
Your product launch Gantt-like chart would have 1000 bars with multiple sub-levels - no problem. We handle complex risk analysis better than anyone. We're fast and accurate.
You've got a start. Now work your risk plan
Plan - to reduce risk as well as increase reward.
- Drill-Down to inspect sources of profit, loss, or risk
- Determine critical factors
- Effects of timing and delay
- Run what if SCENARIOS
- Possible effects of competitive headwinds or regulatory tailwinds
- Make your plan Traceable - Each Bar Annotated with who,when & why
You've looked at ALTERNATIVES, you've minimized risk, and maximized reward
in your plans - given what you know today.
Now
Communicate what you've learned - pitch your project.
With this level of visibility in your planning, would approval of projects be easier?
Now execute - Track results against risk plan
Track achieved results against plan - once the project is running.
IF your results deviate from plan - either your plan was bad, or reality changed. Either way, Tracking allows you to catch deviations sooner. Drill-Down lets you see where in the plan things are going wrong. Annotations let you determine if your plan assumptions were off, or some other factors are affecting results.
With this ability to Manage Risk - how would you change your business processes?