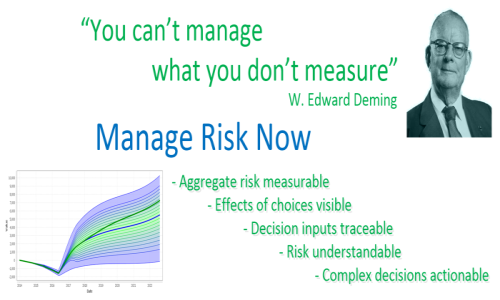
Manage Risk Now We have tools that will help you do that
Aggregate risk measurable.
We do this better than anyone.
The trick is new ( Patentsissued and pending) methods to calculate aggregate risk:
- Faster
- More accurate
- Able to handle more complexity - than anyone else
Measure and track - risk over time - at any and every level in your corporate planning. From single projects, to department aggregates, to divisional summaries, to overall likelihood of achieving corporate objectives.
Effects of choices visable
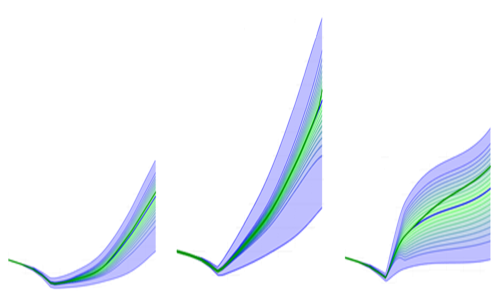
Summary Risk, Scenario Risk, Alternatives
Who in your corporation is committing you to the greatest risk to future profits? How large is that risk? When does it ramp up? What alternatives might mitigate that risk? Is the potential profit worth it?
You plan and track expenditures and profits.
If you could plan exposure to risk and potential reward, and track how
well you do against plan could you increase profits?
Decision inputs traceable.
Drill-down + Annotations
How about investments? Would you like to see expected Risk/Reward for your entire investment portfolio?
- Portfolio aggregate candlestick chart
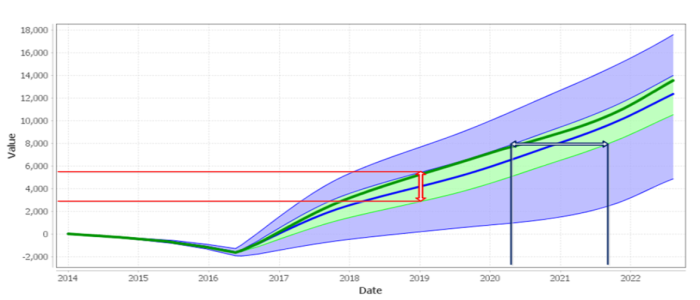
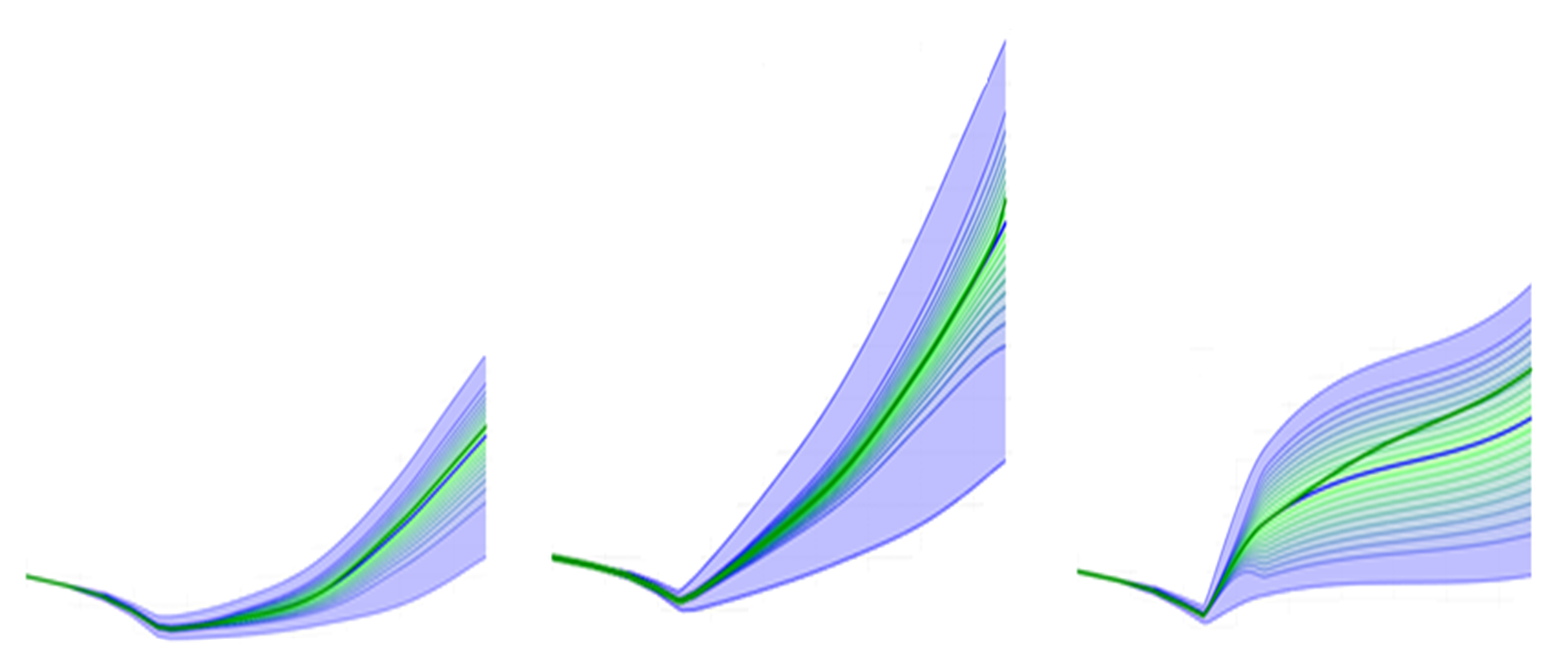
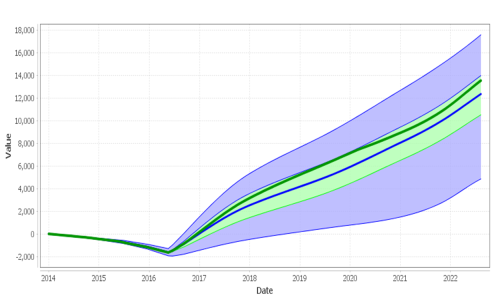
- Portfolio aggregate Probability Fan
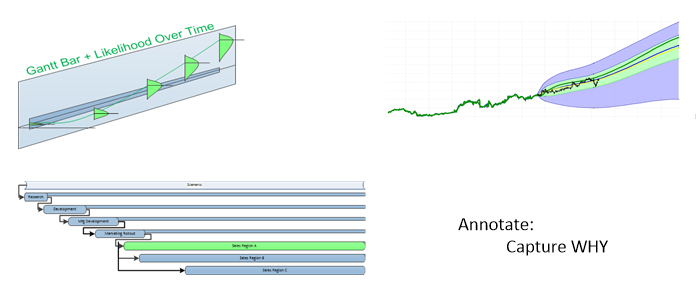
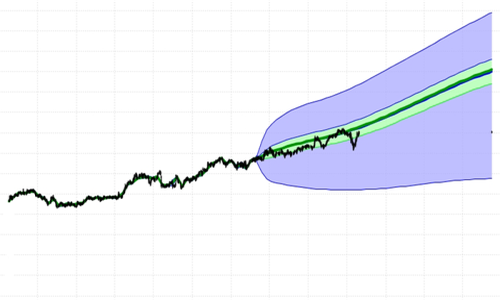
- Aggregate actuals plotted into aggregate Probability Fan
Risk understandable - Gain Insight
Probability Fans + Tracking + Drill-down + Annotations
Risk is visible using Probability Fans.
Deviations from plan durring execution are obvious - using Tracking.
Drill-down lets you find sources of deviation.
Annotations can give you who, when, and why.
FutureValue 4 gives you a fairly complete set of tools to understand the sources of cost, risk, and reward in your portfolio.
Complex decisions actionable
We've developed a system that we think will get you to the next level:
Wisdom
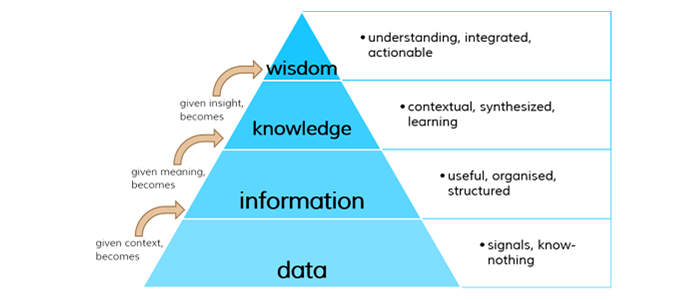
4 Levels:
- Data... bases
- Information... systems
- Knowledge... management systems
- Wisdom... system
The problem with the first 3 levels (Data, Information, Knowledge) is
- they are all passive.
They feed facts into a decision.
Wisdom is actionable: The ability to make sound decisions to reach desired goals.
So, what's wrong with the tools you have?
- Data bases contain: Explicit facts, Dates, Amounts.
- Information systems hold: Collections of Data.
- Knowledge management systems collect: Statements and interactions between statements.
But, there are two types of knowledge:
- Explicit knowledge: who, what, where, when, how much,… quantifiable statements.
- Tacit knowledge: WHY, beliefs, opinions,… non-quantifiable statements.
Data Bases, Information Systems, and Knowledge Management Systems are passive; Feed into a decision, but are not sufficient for a decision to be made.
Of all the knowledge you collect to make a decision, WHY is the most valuable.
Tacit knowledge typically accounts for more than 60% of the knowledge
going into a decision, but is not captured in most current decision support
systems.
We capture WHY.
The way our
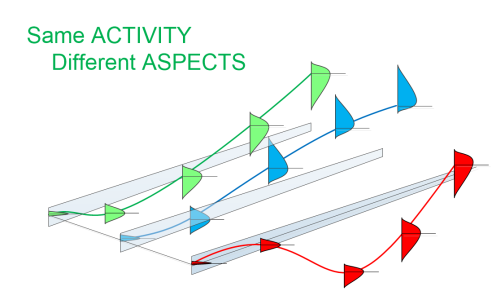
Probability Fans are constructed from user input on Activities, coupled with Annotations,
allow us to capture effects of both Tacit and Explicit knowledge on each
Activity's expected future value.
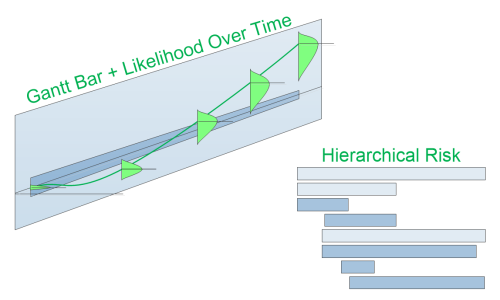
With our software, you can Drill-Down to see the effects of these inputs on every level of aggregation in a Gantt-like chart throughout you plan.
Once the plan is approved and executing, Tracking and Drill-Down make it possible to better take advantage of changes in opportunities and/or cut losses.
