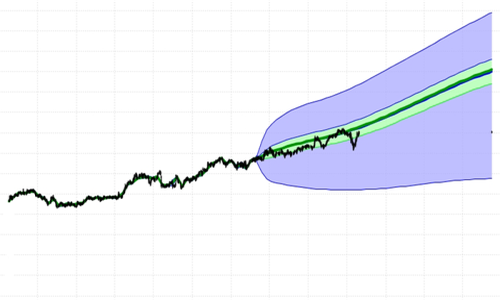
Track - actuals track into plan
Financial use case
Let's say you have a broker that tells you stock A will likely increase in value by 10% to 12% in 12 months, and another 3 stocks (B,C, & D) by 5% to 7% in 12 months.
Build risk models for each stock. Look at aggregate likelihood of risk and reward. Track actuals against thhis portfolio risk plan.
Are your broker's expectations of Risk and Reward now clear?
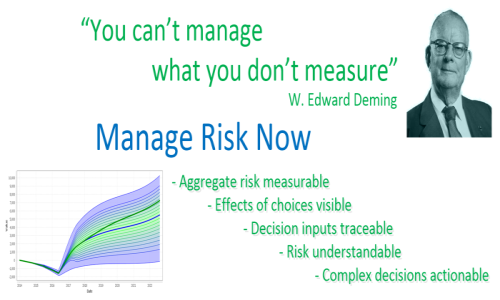
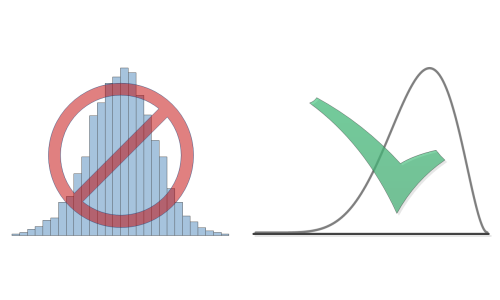
If you can see risk, can you make money?
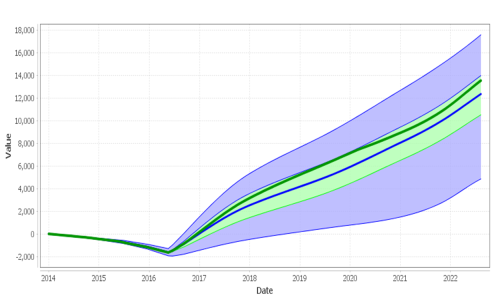
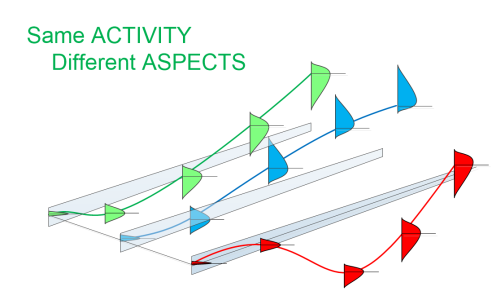
Track Actuals on Probability Fans
Tracking actual achieved value onto the likelihood Probability Fan for every Activity on the plan, and for every level of Summary in the plan means:
- Deviations from plan are caught sooner - corrected sooner - increasing profits.
- Drill-Down from Summary shows which Activity(s) are causing the critical deviations.
You found a deviation from plan.
You
drilled-down and found the source.
Either your plan was bad, or reality changed.
Fix the plan. Put in place mitigatting actions. Cut your losses. Increase
your profits.
Having the ability to see deviations from expectations sooner, and correct sooner increases profits - so far, were seeing by better than 15%.
Details
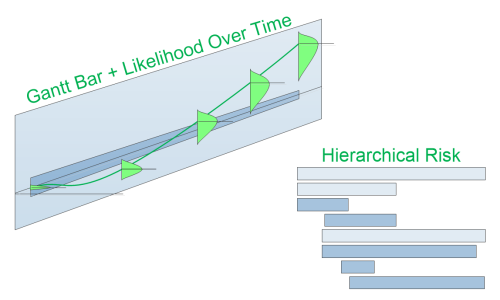
Our Gantt-like Activity bars are made up of components that allow us to do many things:
- View Historic values - on Activities and aggtregate Summaries
- Track completion against likelihood plan
Have you ever before seen Candlestick charts for a portfolio of stocks? Or, the aggregate likelihood of those stock picks achieving the expected profit targets?