FutureValue 4.0 Software
Visualize
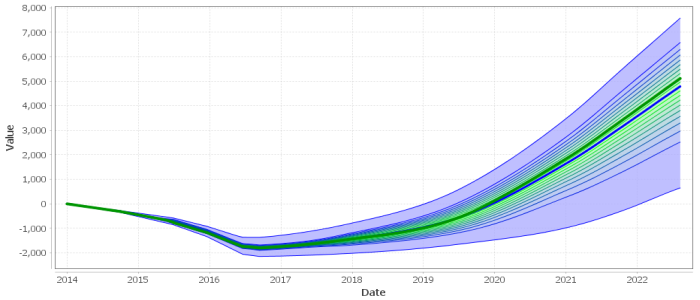
Risk - without heavy statistics
We call it a Probability Fan. It shows Liklihood over Time.
Think of the new business takeoff runway analogy. The Probability Fan shows all the probable flight paths, and Likelihood of profit or loss at all times along the plan.
So, If you were presented this product for funding - would you do it? Likely not.
What if PlanB showed that more agressive Marketing created higher intermediate costs, much faster liftoff, and soaring profits - with increased Risk?
Learn More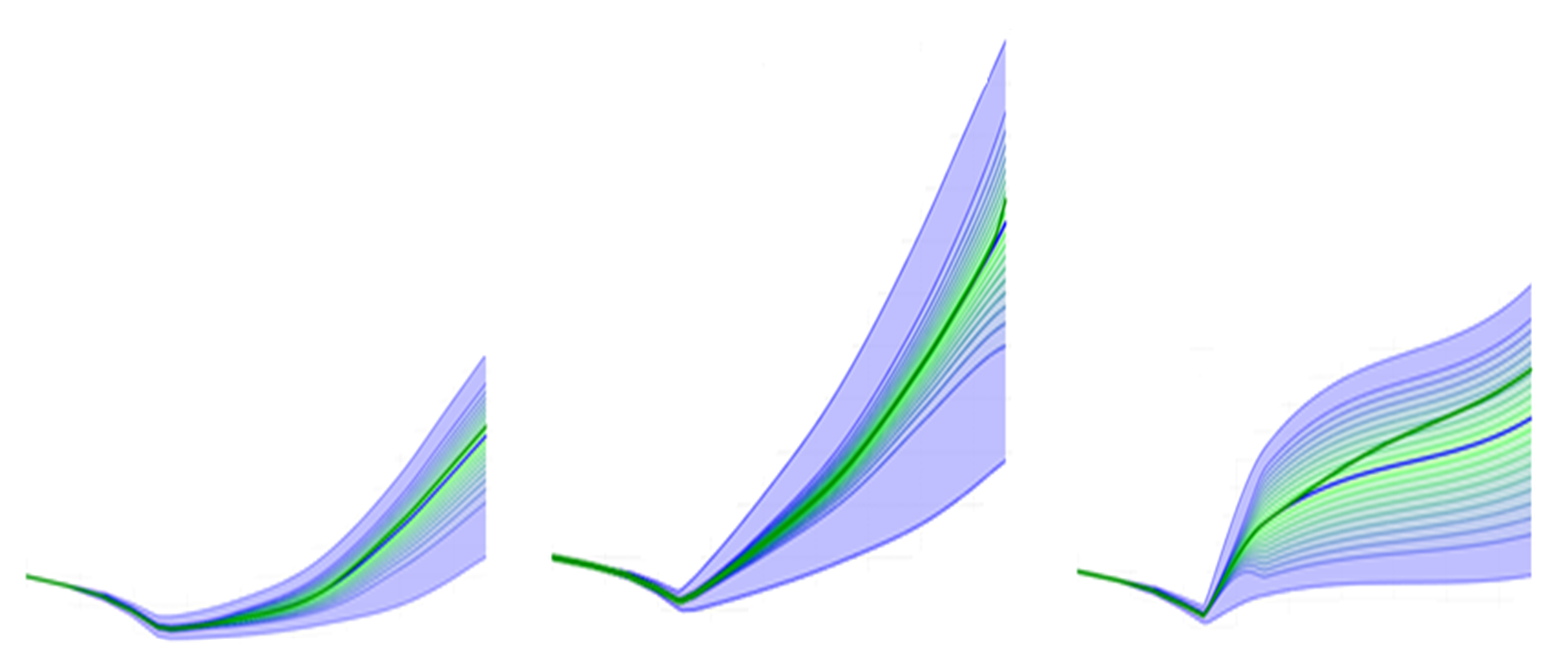
Communicate
Sources of Risk and Reward - at every level
PlanA, PlanB, PlanC - easy to compare Probability Fans.
- Drill-Down to inspect sources of profit, loss, or risk
- Determine critical factors
- Effects of timing and delay
- Run what if SCENARIOS
- Possible effects of competitive headwinds or regulatory tailwinds
- Traceable - Each Bar annotated with who,what,when & why
Would your decisions change if Risk were better communicated?
Learn More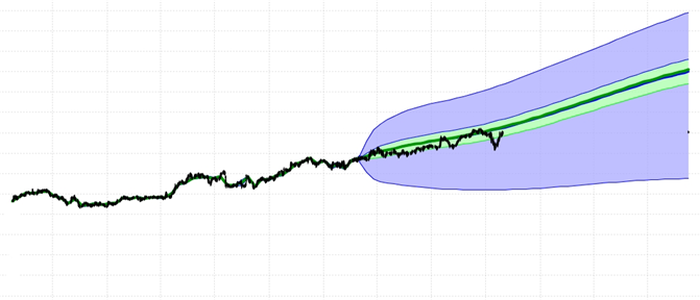
Track
Actuals - Track into Plan
The plot shows:
- Aggregate CandleStick chart for 4 Stocks
- Aggregate Probability Fan for 4 Stocks (green = 50% band)
The aggregate performance is tending to the low side of plan.
You might want to
Drill-Down and see if the Plan is bad, or some stocks are performing poorly.
If you could track aggregate performance against plan like this - and Drill-Down to any level of detail - could you increase profits?
Learn More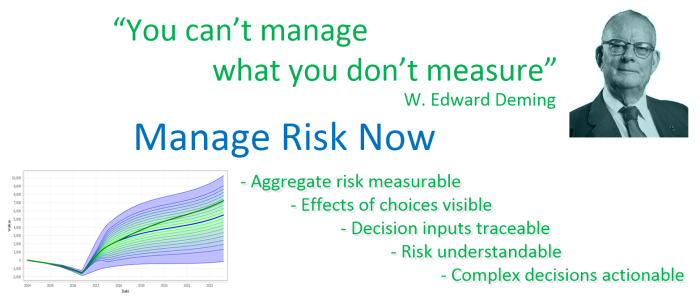
Manage
Now you can measure Risk.
And... Visualize it without heavy statistics.
You could look at aggregate risk and reward over time Probability Fans - for every Project in the Corporation - Drill-Down to the Division level, the Department level, the Team level.
Track performance against Risk plans.
If tracking deviates from plan - was the plan bad, or did reality change?
Drill-Down find out why.
If you update the plan, how does that affect aggregate corporate Risk?
If you could manage Risk could you increase profits?
Learn More