Drill Down Inspect sources of gain, loss, and risk
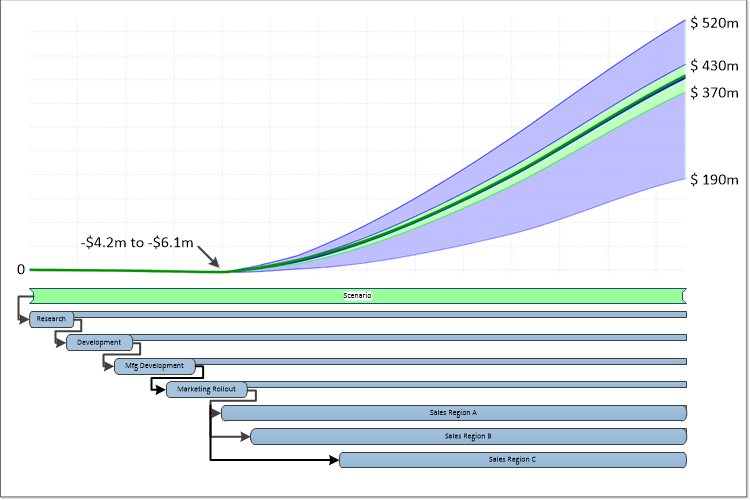
Drill Down
Our underlying heirarchy is similar to a Gantt Chart - but with a few more types of Bars.
Like a typical Gantt Chart, ACTIVITY and SUMMARY bars aggregate into higher level SUMMARY bars.
After inspecting a high level SUMMARY bar's associated Probability Fan, you can drill down to inspect the Probability Fans for the ACTIVITY and SUMMARY bars that made up that aggregate.
By looking at the Probability Fans for each contributing component, you can determine likely sources of risk in the aggregate SUMMARY bar, and with that knowledge, determine methods to mitigate unacceptable levels of risk - or improve reward.
NOTES capture who, when & why
Each
Bar on our Gantt-like chart contains a NOTES field.
The NOTES field allows users to enter annotations tracking:
- who... made this ACTIVITY's risk/value prediction
- when... did they make it
- why... capture their assumptions and reasoning
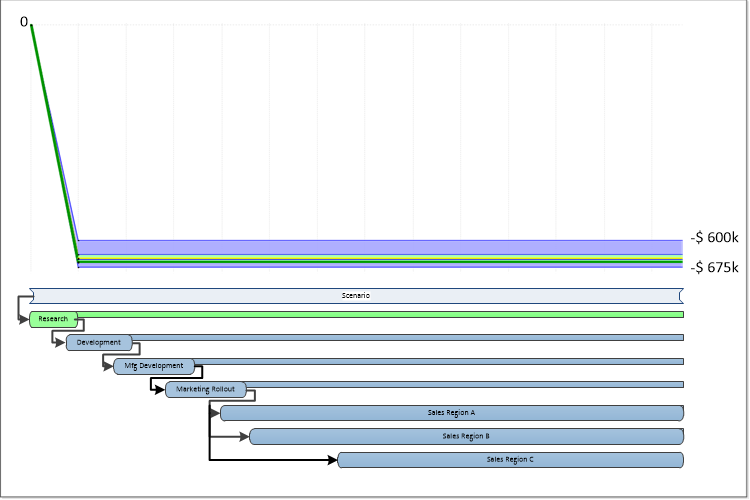
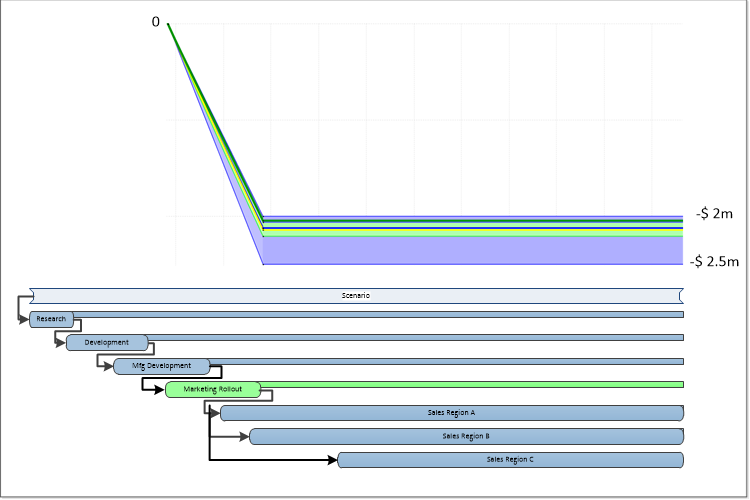
Research
- 5 people @ $100k/person for 6 months - no bonus opportunity - no raises
- $350k to $425k supplies - likely to the high middle of this range - assume linear burn rate
- = -$600k to -$675k at end of 6 month Research effort
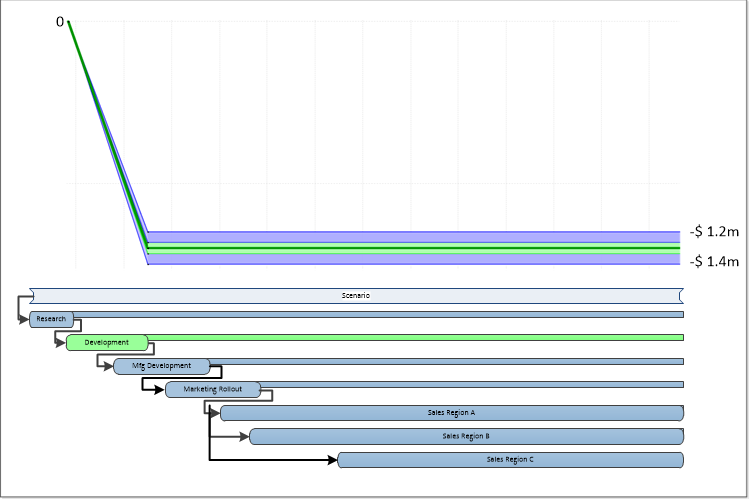
Development
- 8 people @ $100k/person for 9 months - no bonus opportunity - no raises
- $600k to $800k supplies - likely to the middle of this range - assume linear burn rate
- = -$1.2m to -$1.4m at end of 9 months
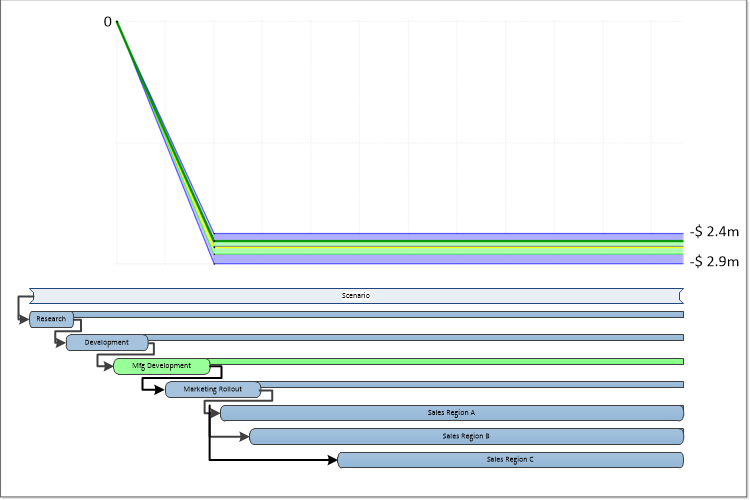
Mfg Development
- 9 people @ $100k/person for 12 months - no bonus opportunity - no raises
- $300k to $500k supplies
- $1.2m to 1.5m capital
- = -2.4m to -2.9m at end of 12 months
Marketing Rollout
- 10 people @ $100k/person for 12 months
- $1m to 1.5m sales/marketing materials/costs
- = -$2.0m to -$2.5m at end of 12 months
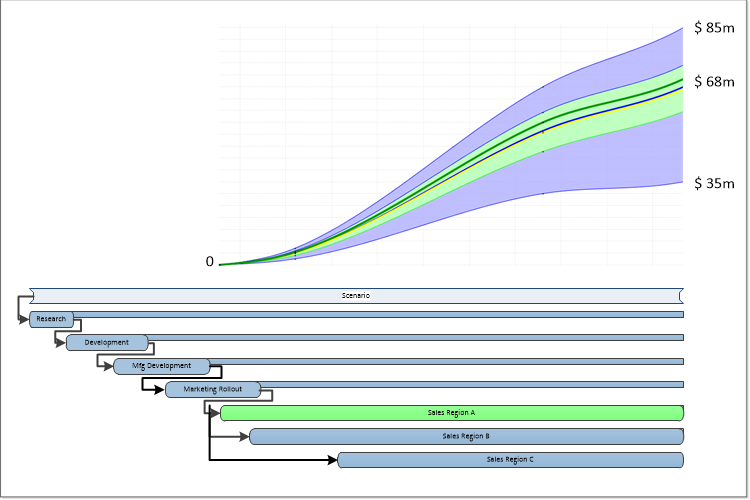
Sales Region A
- Small test market - Establisthed route to market
- Sales taper off in 4th year
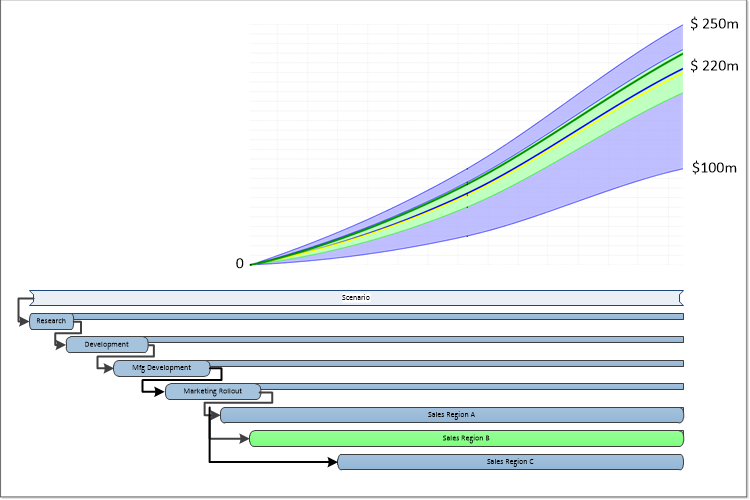
Sales Region B
- Large critical market - Release 5 months later to market - Established route to market
- No sales taper seen in the modeled time period
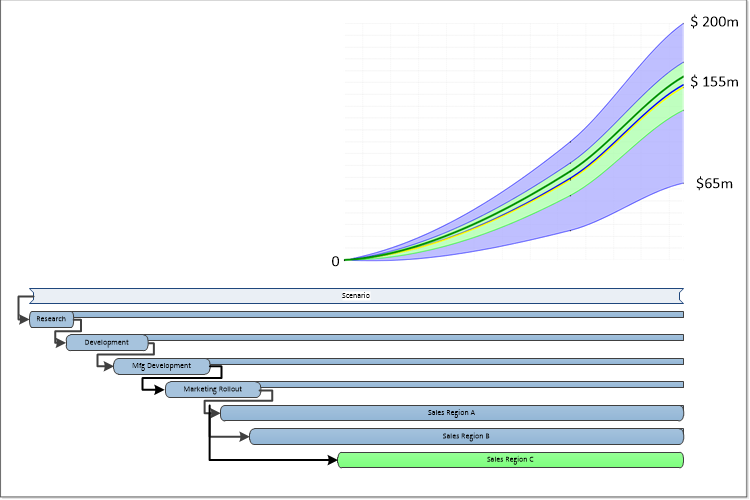
Sales Region C
- Slow market penetration - market similar in size to Region B - need to establish sales channels
- Expect similar rate of sales/population to other regions in later years
It's too simple
So, you don't like some of the assumptions, and, the plan is too simplistic.
If you were running our software, you could build the plan with your assumptions, meeting the complexity of your product launch.
Your product launch Gantt-like chart would have 1000 bars with multiple sub-levels - no problem. We handle complex risk analysis better than anyone. We're fast and accurate .
Would the sources of cost, risk, and reward then be visible?
Would the effects of timing on future profits and risk be visible?
Given this level of visibility to risk, reward, and timing:
would you go forward with your product launch?
What changes would you make to shorten timing?
Now that risk is visible - what could you do to mitigate risk?
How could you increase profits?
With this level of visibility in you planning, could you sell the project to the board?