Multidimensional Risk We can handle thousands of independent sources of risk
Faster - leads to Multidimensional Risk Analysis
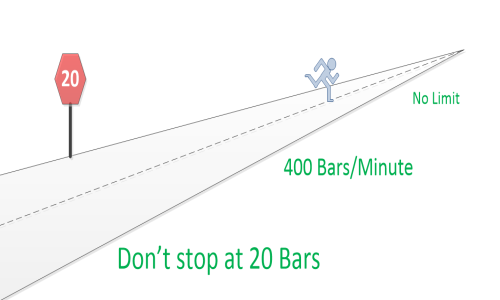
400 truly uncoupled sources of variability - all varying independently
in time - solve to an aggregate
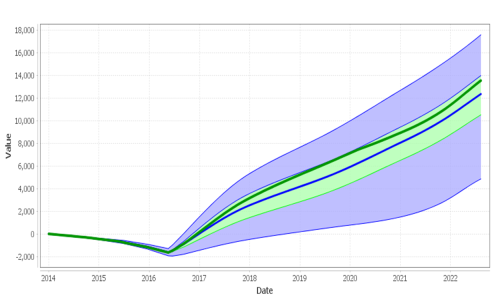
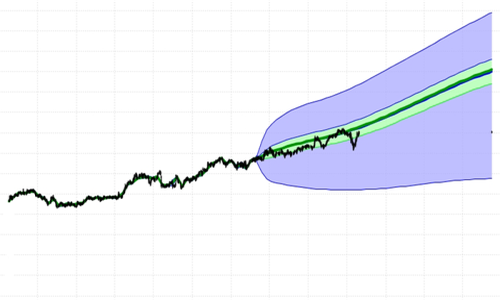
Probability Fan in 1 minute
- 800 solve in 2 minutes
- 1600 solve in 4 minutes
- impossible to do using traditional methods.
Multidimensional in 2 ways:
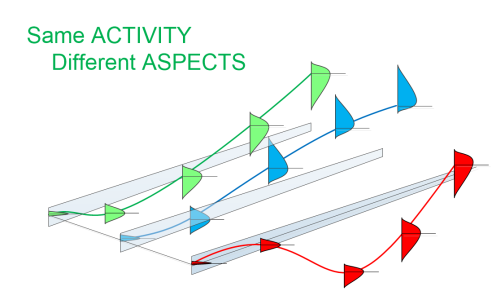
ASPECTS & COLLECTIONS
- ASPECTS of Risk
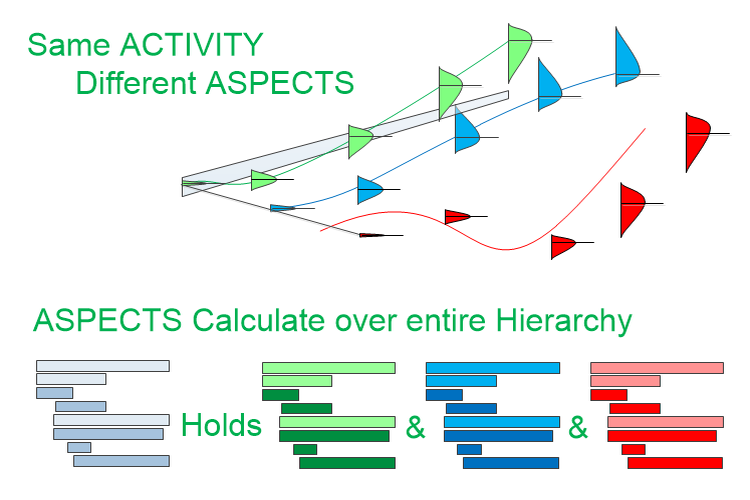
- e.g.: the same potential political ACTIVITY may have two ASPECTs with different probabilities of success: Dollars & Votes
- COLLECTIONS of Risk
- A Bar representing a Stock's potential future price and variability is different from a Bar representing the potential future value of shares you own. A portfolio risk analysis should hold COLLECTIONS of both types of Bars.
ASPECTS of Risk
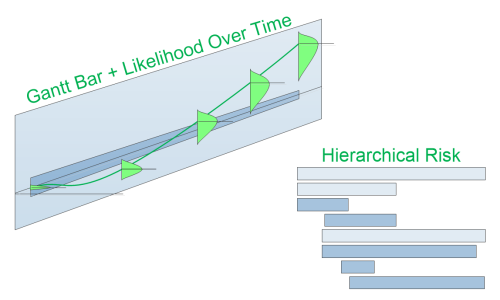
ASPECTS are multiple dimensions of time dependent Risk/Reward - on the same Gantt-like Bar.
- The Bar has one common length - Start date to Stop date duration.
- The Bar holds as many dimensions of Risk/Reward as you would like.
- ASPECT dimensions of Risk/Reward are the same for every COLLECTION of Gantt-like Bars.
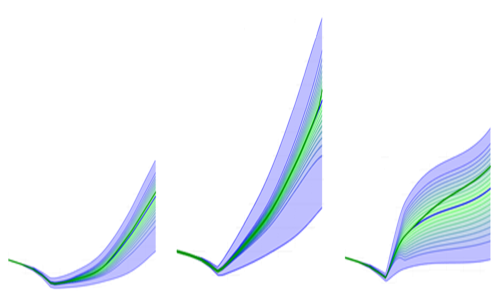
Think of a Gantt-like Bar as holding dimensions of Risk/Reward - e.g. Probability Fans and the data used to generate them.
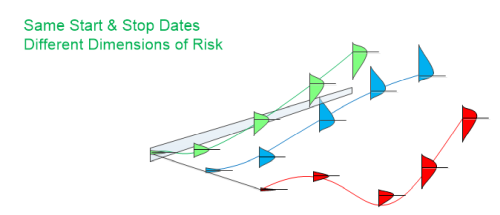
You can model as many ASPECTS of Risk as you would like - until you either
run out of memory on your client computer, or we run out of time on the
server. See:
Faster.
We haven't found the limit yet. On our current small (24 core) server,
we should be able to solve 130,000 Bars x ASPECTS (independent sources
of Risk) per compute hour.
Multidimensional Business Risk
The classic one is: You can have it Faster, Cheaper, or Better - pick
2.
In reality, it's all tradeoffs. But it points out the classic 3 dimensions
of every business plan directed at delivering product to customers: Cost,
Schedule, and Quality
Our Gantt-like Bars already span time. So, we're only dealing with 2 other
dimensions: Cost & Quality.
Our methods are inherently numerical. So, a numerical scale for Quality
would need to be defined. The scale could tie back to Cost or Profits -
reducing the Risk analysis to 1 ASPECT dimension, but other numerical measures
of Quality like
Failure mode and effects analysis ,
Hedonic regression , or some subjective numerical scale unique to your Company could
as easily be used. Also, you could model more than one dimension of Quality
- following the
KANO model or others.
You can start your plans with one ASPECT dimension and add more ASPECTS later, or take a multiddimensional plan and delete ASPECTS later.
So, what drives your business? How could you model the factors that drive your success?
Multidimensional Political Risk
If we were modeling future values on a political process, we might consider
modeling ACTIVITIES that result in potential Votes - but these ACTIVITIES
cost money.
So, our ACTIVITIES have two ASPECT dimensions of Risk/Reward: Dollars
& Votes.
Then, we could have a heirarchy of say SUMMARY Bars that represented States
which in turn summarize voting districts, and ACTIVITY Bars that represent
different local efforts to spend money to generate votes:
- For Georgia - first voting district
- Expected Dollars spent over time & expected Votes generated - by spending Dolars on TV attack adds
- Expected Dollars spent over time & expected Votes generated - by spending Dolars on Radio position adds
- Expected Dollars spent over time & expected Votes generated - by spending Dolars on get out the vote efforts
- For Texas...
- For California...
Multidimensional Military Risk
Or, how about a Military Risk analysis - where the dimensions of Risk might include:
- Military Success - Likelihood on a scale of 0-10 of achieving Objective.
- Political Success - Likelihood on a scale of 0-10 of achieving Objective.
- Dollar cost.
- Cost in troup lives
- Cost in enemy lives
- Cost in friendly lives
- Cost in infrastructure damage
We model likelihood of success - simultaneously - on as many dimensions of Risk as you like.
Make it as complex as you like - with as many ASPECTS ( dimensions of Risk/Reward in the same Collection of Gantt Bars ) as you would like - we can handle it.
Multidimensional Medical Risk
Again, values modeled as ASPECTS on a Gantt-like Bar do not have to be monetary, but they do have to be numeric (something that can be put on a scale, and have probabilities at values attached).
In the health arena, value is patient health outcome, quality of life, cost, time, or perhaps a ratio of values: optimal health for minimal cost, or optimal recovery in shortest time.
Tasks or task aggregates in the Gantt-like chart may represent, national likelihoods, or regional likelihoods, or group likelihoods, or likelihoods for individual procedures and/or specific doctor outcomes.
Treatment paths may be modeled as combinations of tasks over time.
Alternate treatment paths may be modeled as ALTERNATIVE summary Bars -
and overall recovery rates tracked against aggregate SCENARIOS weighted
by % of patients using each planned ALTERNATE.
So, asigning ASPECTS of
- health outcome
- cost
- health outcome over time
- health outcome per unit cost
COLLECTIONS of Risk
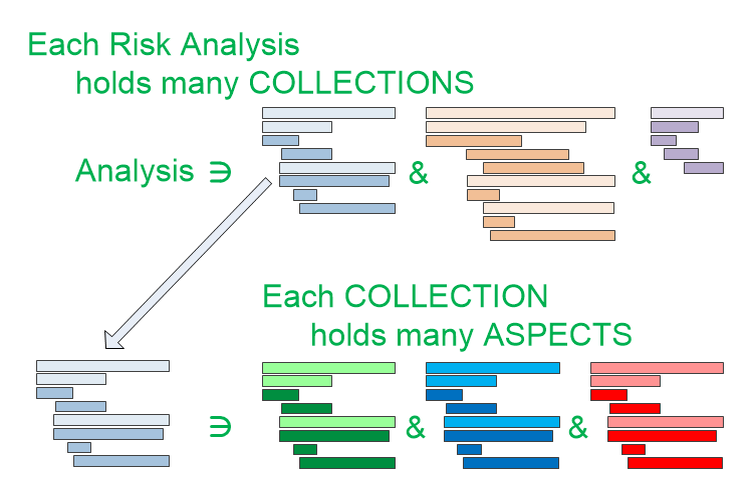
A COLLECTION is a set of Gantt-like Bars that all have the same ASPECTS (same dimensions of Risk/Reward).
Each Risk analysis in FutureValue 4 can contain many COLLECTIONS - each having different ASPECTS - and containing completely different COMPLEX HEIRARCHIES of Bars
COLLECTIONS are available in FutureValue 4, but will really come into their own in FutureValue 5.
More...
We also handle other forms of Complexity:
- COMPLEX HEIRARCHIES of Risk/Reward
- BLENDED RISK over Time calculations
Call us
Call us - if you see a time dependent or non-time dependent Risk/Reward analysis types you would like to see us cover - or other database connectivity - or features you would like to see. Our speed and ease of use give us distinct advantages over others, but features you find useful will determine our worth.
